


-
Financial information
The past year ushered in a series of challenges for the companies in the fuel sector. The decisions made by us have demonstrated that we are able to take rapid steps to adapt to a demanding environment and ensure the desired profitability for our projects.
-
Segment performance
The segmental management model we have implemented enhances management efficiency, delivering cost and revenue synergies across the organization.
-
Letter from the Vice-President of the Board
2014 ushered in a series of challenges for the companies in the fuel sector. The decisions made by the LOTOS Group have demonstrated that we are able to take rapid steps to adapt to a demanding environment and ensure the desired profitability for our projects.
-
Business environment
The key factor that had a strong impact on both the global and Polish petroleum markets in 2014, with significant consequences for the LOTOS Group’s performance, was the price of crude oil, which also determined the price of petroleum products.
-
Strategic objectives
The LOTOS Group’s Strategy is designed to strengthen our position as a strong, innovative and efficient business which plays a major role in ensuring national energy security.
-
Business model
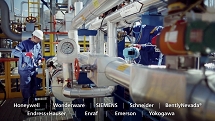
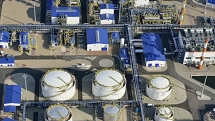
Our operations consist in crude oil production and processing, as well as wholesale and retail sale of petroleum products, among which are: fuels (unleaded gasoline, diesel oil and light fuel oil), heavy fuel oil, bitumens, aviation fuel, naphtha, propane-butane LPG and base oils.
-
Risk and opportunities
At the LOTOS Group, we identify a range of diverse risks, which may affect all areas of our business. The key risks in terms of their impact on our operations are the financial risks as well as risks affecting the exploration and production area. In the analysis of the risks, we also factor in issues related to sustainable development.
-
Key data 2014
With revenue of ca. PLN 28.5bn in 2014, we rank fourth in the group of 500 largest businesses in Poland.

Business environment
The global economic situation in 2014 was below market expectations. The world’s leading economies kept expanding, but the growth rates were often lower than anticipated. The United States was a notable exception − the country’s economic recovery was faster and stronger than predicted by the market. In contrast, Japan lagged behind other major economies. Developed economies were supported by loose monetary policies and efforts to maintain market liquidity. In 2014, global economy continued on a growth path, with the estimated growth rate (3.4%) slightly below that forecast in April last year. In 2014, eurozone GDP growth rate was 0.9%, whereas Poland’s real GDP grew at a rate of 3.4%, faster than in 2013 by 1.7pp.
GDP growth in 2012−2014
| EU | USA | Japan | China | Russia | World | |
|---|---|---|---|---|---|---|
| 2012 | -0.4% | 2.3% | 1.8% | 7.8% | 3.4% | 3.4% |
| 2013 | 0.1% | 2.2% | 1.6% | 7.8% | 1.3% | 3.4% |
| 2014E | 1.4% | 2.4% | -0.1% | 7.4% | 0.6% | 3.4% |
The key factor that had a strong impact on the global and Polish petroleum markets in 2014, with significant consequences for the LOTOS Group’s performance, was the price of crude oil, which also determined the price of petroleum products. In mid-2014, the upward trend in crude oil prices reversed. Contrary to the market expectations, the decline in crude prices did not decelerate after OPEC failed to issue a decision on limiting production. Consequently, between June and December 2014 crude prices fell by approximately 50%, disrupting market stability, in particular in the production segment, and leading to bankruptcies of smaller production and service companies, chiefly in the US. The sudden downward trend emerged after nearly four years of stable prices.
This unstable crude market forced many international companies to adopt cost-cutting measures and substantially reduce capital expenditure, for instance by putting off investments until the market stabilises again.
Further, it was observed that resources available at low production cost will become depleted in the long term. New deposits require a lot more capital outlay, which drives up the per-barrel price of the oil produced. At present, hydrocarbon exploration and production activity is concentrated in the US shale plays, offshore areas with deposits located at great depths, and offshore polar regions. The expected increase in production of oil and gas from those sources will require higher expenditure per barrel of oil equivalent, which may be reflected in hydrocarbon market prices.
Global refining market
For a number of years, global crude oil production and consumption has been on the rise. The trend has been accompanied by a shift of fuel consumption to non-OECD developing countries.
The consequence of changes in the global economy, including in demography, were particularly felt in Europe. Demand for fuels in the EU has consistently declined since 2007.
The rising demand for fuels, in particular in Asia, results in expansion of refining capacities, with major projects executed in China and India, the two largest developing economies. EU’s refineries show a rather different trend – it is necessary to reduce the least effective units.
To ensure a balanced fuel market in Europe, fuel producers shut down several refineries in recent years. However, this scaling back still seems to be insufficient, as many European refineries generate small returns, and their processing capacities are relatively low. Small refineries with low complexity are particularly exposed to the risk of closure, given their high unit operating costs.
| Year of shutdown | Refinery | Capacity (‘000 bbl/d) | Owner | Country |
|---|---|---|---|---|
| 2015 | Collombey | 72 | Tamoil | Switzerland |
| 2015 | Gela | 105 | Eni | Italy |
| 2014 | Milford Haven | 135 | Murphy Oil | United Kingdom |
| 2014 | Stanlow | 55 | Essar Energy | United Kingdom |
| 2014 | Mantova | 57 | Eni | Italy |
| 2014 | Paramo | 20 | Unipetrol | Czech Republic |
| 2013 | Harburg | 90 | Shell | Germany |
| 2013 | Porto Marghera | 80 | Eni | Italy |
| 2012 | Coryton | 172 | Petroplus | United Kingdom |
| 2012 | Fawley | 80 | ExxonMobil | United Kingdom |
| 2012 | Kherson | 138 | Alliance Oil Co. | Ukraine |
| 2012 | Drogobich | 78 | Ukraine Oil Co. | Ukraine |
| 2012 | Petit Couronne | 154 | Petroplus | France |
| 2012 | Berre l’Etang | 105 | LyondellBasel | France |
| 2012 | Roma | 85 | Total ERG | Italy |
Source: In-house analysis based on JBC data.
A significant change in that landscape occurred in late 2014, spurred by a significant fall of oil prices, from approximately 110 USD/bbl to less than 60 USD/bbl. The price decline was chiefly driven by the structural oversupply of oil in the market (according to the International Energy Agency, the oversupply reached about 0.7m boe/d, i.e. 0.7%-0.8% of global demand), increased geopolitical risk, OPEC’s abandonment of the policy of balancing global oil demand and supply, and appreciation of the US dollar.
The US refineries very quickly lost one of their major elements of competitive advantage – inexpensive oil (shale oil produced in the United States had been much cheaper than oil traded on the international market). On the other hand, cheaper fuel encouraged a higher number of consumers to travel, boosting demand. In effect, the competitiveness of European refineries greatly improved. Refining margins earned by European refineries approached a level similar to that of refineries located in other parts of the world.
International fuel market
Demand for oil refining products in 2014 rose by 0.9% globally. Stronger demand was seen in the gasolines (1.4%) and diesel oil (3.1%) segments. The estimated consumption of LPG and jet fuel also increased (by 1.0% and 1.9%, respectively). However, the demand for light fuel oil fell (by 5.4%).
Global consumption of fuels [‘000 bbl/d]
| 2012 | 2013 | 2014E | |
|---|---|---|---|
| Gasolines | 22,824 | 23,183 | 23,514 |
| Diesel oil | 20,470 | 21,256 | 21,911 |
| JET | 6,435 | 6,530 | 6,658 |
| LPG (Liquefied Petroleum Gas) | 7,520 | 7,964 | 8,047 |
| Light fuel oil | 5,710 | 5,302 | 5,013 |
Source: In-house analysis based on JBC data, April 2015.
According to forecasts, the overall global consumption of refining products is expected to grow by over 6.5% until 2020. It is estimated that demand for LPG, diesel oil, and JET fuel will grow significantly over the 2014 consumption (up 14%, 13% and 12%, respectively). The global consumption should rise slightly (4%). Light fuel oil consumption is expected to fall by 21%.
Forecast global consumption of fuels [‘000 bbl/d]
| 2014E | 2015P | 2020P | |
|---|---|---|---|
| Gasolines | 23,514 | 23,945 | 24,463 |
| Diesel oil | 21,911 | 22,497 | 24,680 |
| JET | 6,658 | 6,805 | 7,463 |
| LPG (Liquefied Petroleum Gas) | 8,047 | 8,299 | 9,189 |
| Light fuel oil | 5,013 | 4,911 | 3,968 |
Source: In-house analysis based on JBC data, April 2015.
Consumption of petroleum products in Europe declined in 2014 by 1.0%. However, diesel oil, JET fuel and LPG saw an increase of 1.2% and 1.6% respectively. Consumption of gasolines, light fuel oil and LPG fell by 1.5%, 9.7% and 1.0% respectively. The changes in fuel consumption in Europe reflect the economic conditions in EU Member States and the Eurozone countries.
The demand for oil refining products is forecast to fall in Europe by 2.7% until 2020. According to estimates, one of the reasons behind the decline will be a significant drop in consumption of gasolines, exceeding 11%. Lower consumption is also expected to affect the light fuel oil market (-18%). Concurrently, a strong increase is expected in consumption of LPG − by 7.3%, JET fuel − by 6.8%, and diesel oil − by 2.2%.
Forecast consumption of fuels in Europe [‘000 bbl/d]
| 2014E | 2015P | 2020P | |
|---|---|---|---|
| Gasolines | 2,110 | 2,071 | 1,877 |
| Diesel oil | 5,391 | 5,521 | 5,508 |
| JET | 1,260 | 1,269 | 1,346 |
| LPG (Liquefied Petroleum Gas) | 1,104 | 1,114 | 1,184 |
| Light fuel oil | 1,046 | 1,063 | 862 |
Source: In-house analysis based on JBC data, April 2015.
In the European car market, new car registrations grew by 5% in 2014, to 13m new cars. A marked improvement was also recorded in the utility vehicles segment, with new registrations up by 7% (to 1.9m new vehicles). In the group of registered new cars, there is a continued growing interest in diesel-fuelled cars. The share of such cars in total new car registrations in Western Europe was more than 53% in 2013 (compared with 46% in 2009).
Polish fuel market
Domestic demand for fuels is shaped by the general economic situation in Poland and the region. In the last three years, the Polish fuel market has been faced with the challenge of the growing grey market driven by high fuel prices and the economic slowdown observed in the recent years. In 2014, the Polish government’s efforts involving the implementation of a stricter control regime and change in regulations, including in the energy law, coupled with falling prices in the second half of the year, limited the growth of the grey market compared with the previous years, with official diesel oil consumption at 11,297 thousand tonnes, down 0.3% year on year. The real market for diesel oil is determined by the constantly growing number of vehicles running on diesel oil (by 7% per annum on average) and continued increase in transport activity. It is estimated that the present diesel oil consumption is similar to that recorded in 2011, when the number of diesel oil-fuelled vehicles on the market was smaller by approximately 1.5m.
Gasoline sales on the Polish market in 2014 followed the trends prevailing in other parts of Europe and continued to fall. The demand for gasoline dropped by 1.7%, to 3,655 thousand tonnes. Weaker demand is mainly attributable to improved effectiveness of vehicles and the growing attractiveness of alternative air transport. The economic conditions, including reduced unemployment and falling fuel prices recorded in the second half of the year, contributed to the fact that the decline in demand for gasoline was not as severe as in 2013.
The consumption of LPG, which serves as a substitute of gasoline, dropped in 2014 by 1.3%, to 2,292 thousand tonnes. The LPG market in Poland may be recognised as mature, with consumption at approximately 2,200 thousand tonnes in the last five years.
Demand for light fuel oil in 2014 continued to fall, and contracted by 15.5%, to 712 thousand tonnes. This market segment was affected by increased interest in alternative heating fuels and higher average temperatures in the heating season.
The fastest growing market was the aviation fuel market. Consumption of aviation fuel in 2014 rose 15.4%. Thanks to the growing number of airline services, expansion of new airlines and consistent increase in the number of passengers, the market is viewed as promising and is expected to grow in the years to come.
Consumption of fuels in Poland [‘000 tonnes]
| 2013 | 2014E | |
|---|---|---|
| Diesel oil | 11,332 | 11,297 |
| Gasolines | 3,719 | 3,655 |
| Light fuel oil | 843 | 712 |
| LPG (Liquefied Petroleum Gas) | 2,323 | 2,292 |
| Aviation fuel | 541 | 624 |
Source: In-house analysis of Polish Organization of Oil Industry and Trade (POPiHN) data.
Polish retail fuel market
In 2014, there were nearly 6,500 service stations operating in Poland. As in the previous years, more than one third of the stations belonged to domestic operators, 22% were owned by international corporations, while 42% operated independently. The chains owned by oil companies were developed by opening both own stations (CODO) and partner stations (DOFO).
In 2014, according to POPiHN’s estimates, 240 independent stations disappeared from the market, in most cases owing to the new technical requirements applicable to service stations. Over the same period, there was also a decline in the number of oil-company-owned stations, attributable mainly to Shell’s sale of some of the stations purchased from Neste in the previous year.
Expansion of Poland’s motorway network has been accompanied by the appearance of a growing number of motorway service stations. At the end of the year, there were 71 Motorway Service Areas (MSAs) in Poland.