


-
Financial information
The past year ushered in a series of challenges for the companies in the fuel sector. The decisions made by us have demonstrated that we are able to take rapid steps to adapt to a demanding environment and ensure the desired profitability for our projects.
-
Segment performance
The segmental management model we have implemented enhances management efficiency, delivering cost and revenue synergies across the organization.
-
Letter from the Vice-President of the Board
2014 ushered in a series of challenges for the companies in the fuel sector. The decisions made by the LOTOS Group have demonstrated that we are able to take rapid steps to adapt to a demanding environment and ensure the desired profitability for our projects.
-
Business environment
The key factor that had a strong impact on both the global and Polish petroleum markets in 2014, with significant consequences for the LOTOS Group’s performance, was the price of crude oil, which also determined the price of petroleum products.
-
Strategic objectives
The LOTOS Group’s Strategy is designed to strengthen our position as a strong, innovative and efficient business which plays a major role in ensuring national energy security.
-
Business model
Our operations consist in crude oil production and processing, as well as wholesale and retail sale of petroleum products, among which are: fuels (unleaded gasoline, diesel oil and light fuel oil), heavy fuel oil, bitumens, aviation fuel, naphtha, propane-butane LPG and base oils.
-
Risk and opportunities
At the LOTOS Group, we identify a range of diverse risks, which may affect all areas of our business. The key risks in terms of their impact on our operations are the financial risks as well as risks affecting the exploration and production area. In the analysis of the risks, we also factor in issues related to sustainable development.
-
Key data 2014
With revenue of ca. PLN 28.5bn in 2014, we rank fourth in the group of 500 largest businesses in Poland.

← Statement Notes index
8. Business segments
The following exchange rates were used in the valuation of items of the statement of financial position:
| PLN ’000 | Upstream segment | Downstream segment | Other (1) | Consolidation adjustments | Consolidated |
|---|---|---|---|---|---|
| year ended Dec 31 2014 | |||||
| Revenue: | 906,279 | 28,157,947 | 25,535 | (587,874) | 28,501,887 |
| Intersegment sales | 523,278 | 47,559 | 17,037 | (587,874) | - |
| External sales | 383,001 | 28,110,388 | 8,498 | - | 28,501,887 |
| Operating profit/(loss) (EBIT) | (624,120) (2) | (774,492) (3) | 6,914 | (1,310) | (1,393,008) |
| Amortisation | 344,141 | 459,449 | 7,137 | (1,786) | 808,941 |
| Operating profit/(loss) before amortisation and depreciation (EBITDA) | (279,979) | (315,043) | 14,051 | (3,096) | (584,067) |
| PLN ’000 | Upstream segment | Downstream segment | Other (1) | Consolidation adjustments | Consolidated |
|---|---|---|---|---|---|
| Dec 31 2014 | |||||
| Total assets | 3,944,812 | 16,028,893 | 112,330 | (1,138,878) | 18,947,157 |
| including: | |||||
| - assets related to exploration for and evaluation of crude oil and natural gas resources | 241,445 | - | - | - | 241,445 |
| - assets related to development and production of crude oil and natural gas resources | 1,331,027 | - | - | - | 1,331,027 |
| PLN ’000 | Upstream segment | Downstream segment | Other (1) | Consolidation adjustments | Consolidated |
|---|---|---|---|---|---|
| year ended Dec 31 2013 (restated) |
|||||
| Revenue: | 585,759 | 28,587,306 | 24,474 | (638,374) | 28,559,165 |
| Intersegment sales | 578,369 | 43,093 | 16,912 | (638,374) | - |
| External sales | 7,390 | 28,544,213 | 7,562 | - | 28,559,165 |
| Operating profit/(loss) (EBIT) | 174,036 | 13,902 | 13,937 | (35,275) | 166,600 |
| Amortisation | 133,607 | 500,804 | 9,860 | (1,791) | 642,480 |
| Operating profit/(loss) before amortisation and depreciation (EBITDA) | 307,643 | 514,706 | 23,797 | (37,066) | 809,080 |
| PLN ’000 | Upstream segment | Downstream segment | Other (1) | Consolidation adjustments | Consolidated |
|---|---|---|---|---|---|
| Dec 31 2013 (restated) | |||||
| Total assets | 4,101,632 | 17,059,568 | 120,425 | (996,871) | 20,284,754 |
| including: | |||||
| - assets related to exploration for and evaluation of crude oil and natural gas resources | 368,357 | - | - | - | 368,357 |
| - assets related to development and production of crude oil and natural gas resources | 1,894,133 | - | - | - | 1,894,133 |
(1) Includes LOTOS Park Technologiczny Sp. z o.o., LOTOS Gaz S.A. w likwidacji (in liquidation) and Energobaltic Sp. z o.o.
(2) Including an impairment loss on YME field assets, of PLN 578,448 thousand (see Note 13).
(3) Including an inventory write-down of PLN 450,891 thousand (see Note 19.1).
Geographical structure of sales
| PLN ’000 | Upstream segment | Downstream segment | Other (1) | Consolidated |
|---|---|---|---|---|
| year ended Dec 31 2014 | ||||
| Domestic sales: | 3,921 | 19,019,321 | 8,498 | 19,031,740 |
| products and services | 3,719 | 18,315,224 | 8,498 | 18,327,441 |
| merchandise and materials | 202 | 704,097 | - | 704,299 |
| Export sales: | 379,080 | 9,091,067 | - | 9,470,147 |
| products and services | 378,404 | 8,673,940 | - | 9,052,344 |
| merchandise and materials | 676 | 417,127 | - | 417,803 |
| Total | 383,001 | 28,110,388 | 8,498 | 28,501,887 |
| PLN ’000 | Upstream segment | Downstream segment | Other (1) | Consolidated |
|---|---|---|---|---|
| year ended Dec 31 2013 (restated) |
||||
| Domestic sales: | 6,491 | 20,370,299 | 7,562 | 20,384,352 |
| products and services | 6,257 | 18,804,309 | 7,562 | 18,818,128 |
| merchandise and materials | 234 | 1,565,990 | - | 1,566,224 |
| Export sales: | 899 | 8,173,914 | - | 8,174,813 |
| products and services | 606 | 7,835,360 | - | 7,835,966 |
| merchandise and materials | 293 | 338,554 | - | 338,847 |
| Total | 7,390 | 28,544,213 | 7,562 | 28,559,165 |
(1) Includes LOTOS Park Technologiczny Sp. z o.o., LOTOS Gaz S.A. w likwidacji (in liquidation) and Energobaltic Sp. z o.o.
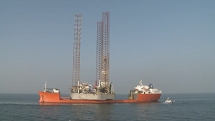
The year-on-year increase in the upstream segment’s sales in 2014 was attributable to the launch of sales of oil and gas produced from the Heimdal area fields, acquired in December 2013.
The year-on-year decline in revenue from sales of merchandise in 2014 was due to the fact that continuity of supplies to the Group’s trading partners was maintained during the refinery’s overhaul shutdown in Q1 2013.
Sales by products, merchandise and services
| PLN ’000 | Upstream segment | Downstream segment | Other (1) | Consolidated |
|---|---|---|---|---|
| year ended Dec 31 2014 | ||||
| Gasolines | - | 4,660,642 | - | 4,660,642 |
| Naphtha | - | 750,974 | - | 750,974 |
| Diesel oils | - | 13,608,087 | - | 13,608,087 |
| Bunker fuel | - | 108,467 | - | 108,467 |
| Light fuel oil | - | 757,506 | - | 757,506 |
| Heavy fuel oil | - | 2,349,680 | - | 2,349,680 |
| Aviation fuel | - | 2,044,246 | - | 2,044,246 |
| Lubricants | - | 345,702 | - | 345,702 |
| Base oils | - | 580,307 | - | 580,307 |
| Bitumens | - | 1,055,843 | - | 1,055,843 |
| LPG | - | 629,750 | - | 629,750 |
| Crude oil | 156,103 | - | - | 156,103 |
| Natural gas | 218,843 | - | - | 218,843 |
| Reformate | - | 28,689 | - | 28,689 |
| Other refinery products, merchandise and materials | - | 553,505 | - | 553,505 |
| Other products, merchandise and materials | 881 | 320,948 | 8,457 | 330,286 |
| Services | 7,174 | 324,034 | 41 | 331,249 |
| Effect of cash flow hedge accounting | - | (7,992) | - | (7,992) |
| Total | 383,001 | 28,110,388 | 8,498 | 28,501,887 |
| PLN ’000 | Upstream segment | Downstream segment | Other (1) | Consolidated |
|---|---|---|---|---|
| year ended Dec 31 2013 (restated) |
||||
| Gasolines | - | 5,010,064 | - | 5,010,064 |
| Naphtha | - | 824,241 | - | 824,241 |
| Diesel oils | - | 14,365,265 | - | 14,365,265 |
| Bunker fuel | - | 124,661 | - | 124,661 |
| Light fuel oil | - | 942,434 | - | 942,434 |
| Heavy fuel oil | - | 2,037,899 | - | 2,037,899 |
| Aviation fuel | - | 1,474,528 | - | 1,474,528 |
| Lubricants | - | 380,218 | - | 380,218 |
| Base oils | - | 485,887 | - | 485,887 |
| Bitumens | - | 1,246,061 | - | 1,246,061 |
| LPG | - | 564,540 | - | 564,540 |
| Other refinery products, merchandise and materials | - | 517,155 | - | 517,155 |
| Other products, merchandise and materials | 530 | 292,630 | 7,523 | 300,683 |
| Services | 6,860 | 291,082 | 39 | 297,981 |
| Effect of cash flow hedge accounting | - | (12,452) | - | (12,452) |
| Total | 7,390 | 28,544,213 | 7,562 | 28,559,165 |
(1) Includes LOTOS Park Technologiczny Sp. z o.o., LOTOS Gaz S.A. w likwidacji (in liquidation) and Energobaltic Sp. z o.o.
In 2014 and 2013, there were no customers whose share in the LOTOS Group’s total revenue would significantly exceed 10%.
The Notes to the consolidated financial statements are an integral part of the statements.
(This is a translation of a document originally issued in Polish)