


-
Financial information
The past year ushered in a series of challenges for the companies in the fuel sector. The decisions made by us have demonstrated that we are able to take rapid steps to adapt to a demanding environment and ensure the desired profitability for our projects.
-
Segment performance
The segmental management model we have implemented enhances management efficiency, delivering cost and revenue synergies across the organization.
-
Letter from the Vice-President of the Board
2014 ushered in a series of challenges for the companies in the fuel sector. The decisions made by the LOTOS Group have demonstrated that we are able to take rapid steps to adapt to a demanding environment and ensure the desired profitability for our projects.
-
Business environment
The key factor that had a strong impact on both the global and Polish petroleum markets in 2014, with significant consequences for the LOTOS Group’s performance, was the price of crude oil, which also determined the price of petroleum products.
-
Strategic objectives
The LOTOS Group’s Strategy is designed to strengthen our position as a strong, innovative and efficient business which plays a major role in ensuring national energy security.
-
Business model
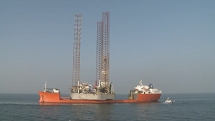
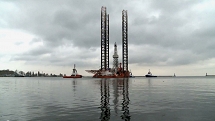
Our operations consist in crude oil production and processing, as well as wholesale and retail sale of petroleum products, among which are: fuels (unleaded gasoline, diesel oil and light fuel oil), heavy fuel oil, bitumens, aviation fuel, naphtha, propane-butane LPG and base oils.
-
Risk and opportunities
At the LOTOS Group, we identify a range of diverse risks, which may affect all areas of our business. The key risks in terms of their impact on our operations are the financial risks as well as risks affecting the exploration and production area. In the analysis of the risks, we also factor in issues related to sustainable development.
-
Key data 2014
With revenue of ca. PLN 28.5bn in 2014, we rank fourth in the group of 500 largest businesses in Poland.

Consolidated statement of financial position
| Reset Sort ascending Sort descending |
31.03.2008 |
30.06.2008 |
30.09.2008 |
31.12.2008 |
31.03.2009 |
30.06.2009 |
30.09.2009 |
31.12.2009 |
31.03.2010 |
30.06.2010 |
30.09.2010 |
31.12.2010 |
31.03.2011 |
30.06.2011 |
30.09.2011 |
31.12.2011 |
31.03.2012 |
30.06.2012 |
30.09.2012 |
31.12.2012 |
31.03.2013 |
30.06.2013 |
30.09.2013 |
31.12.2013 |
31.03.2014 |
30.06.2014 |
30.09.2014 |
31.12.2014 |
|
|---|---|---|---|---|---|---|---|---|---|---|---|---|---|---|---|---|---|---|---|---|---|---|---|---|---|---|---|---|---|
| Assets | PLN m | 10,292.2 | 11,102.5 | 13,057.9 | 12,319.9 | 13,141.0 | 14,507.4 | 14,952.4 | 15,216.0 | 15,761.6 | 17,091.6 | 17,016.4 | 17,727.4 | 19,044.3 | 19,576.7 | 20,466.1 | 20,396.6 | 20,472.4 | 19,959.0 | 20,357.9 | 20,005.0 | 19,932.1 | 20,249.9 | 19,961.0 | 20,284.8 | 19,652.6 | 19,633.6 | 19,935.1 | 18,947.3 |
| Fixed assets | PLN m | 5,062.2 | 5,423.4 | 6,552.8 | 7,273.3 | 8,508.3 | 8,971.2 | 9,603.9 | 10,091.9 | 10,412.5 | 10,852.5 | 10,737.7 | 10,872.1 | 11,228.9 | 11,270.8 | 11,565.7 | 11,582.2 | 11,478.8 | 11,231.3 | 11,215.3 | 11,501.4 | 11,796.3 | 11,618.6 | 11,556.2 | 11,979.9 | 12,260.4 | 11,917.4 | 12,007.5 | 11,781.9 |
| Current assets, including: | PLN m | 5,225.7 | 5,674.9 | 6,499.5 | 5,038.0 | 4,624.3 | 5,531.9 | 5,344.1 | 5,118.9 | 5,344.6 | 6,234.7 | 6,273.1 | 6,847.4 | 7,815.4 | 8,196.1 | 8,782.2 | 8,705.3 | 8,991.8 | 8,726.0 | 9,140.9 | 8,501.2 | 8,134.2 | 8,621.6 | 8,393.6 | 8,304.1 | 7,391.4 | 7,715.9 | 7,925.6 | 7,154.9 |
| Inventories | PLN m | 2,881.2 | 3,072.3 | 3,376.7 | 2,447.2 | 2,509.3 | 2,918.8 | 2,936.2 | 3,023.1 | 3,088.3 | 3,806.8 | 3,850.5 | 4,506.8 | 4,742.1 | 5,270.9 | 5,766.2 | 5,855.8 | 6,190.6 | 5,790.6 | 5,834.8 | 5,963.0 | 5,747.8 | 5,801.9 | 5,404.9 | 5,728.9 | 4,703.0 | 5,073.7 | 4,911.2 | 3,917.1 |
| Trade receivables | PLN m | 1,455.6 | 1,780.0 | 1,863.1 | 1,216.0 | 1,280.6 | 1,583.3 | 1,729.8 | 1,460.8 | 1,701.7 | 1,753.7 | 1,853.3 | 1,740.9 | 2,287.2 | 2,266.6 | 2,322.5 | 2,071.3 | 2,070.3 | 2,167.0 | 2,388.0 | 1,625.7 | 1,581.1 | 1,950.4 | 2,257.8 | 1,591.7 | 1,889.5 | 1,644.2 | 2,112.1 | 1,406.5 |
| Cash and cash equivalents | PLN m | 786.4 | 703.3 | 1,047.1 | 674.1 | 442.8 | 610.5 | 410.1 | 345.1 | 398.9 | 436.3 | 407.3 | 382.6 | 520.1 | 342.0 | 390.2 | 383.7 | 301.7 | 367.5 | 480.8 | 266.1 | 285.1 | 345.9 | 306.3 | 495.8 | 336.0 | 441.8 | 404.0 | 348.2 |
| Assets held for sale | PLN m | 4.3 | 4.2 | 5.6 | 8.6 | 8.4 | 4.3 | 4.4 | 5.2 | 4.5 | 4.4 | 5.6 | 7.9 | 0.0 | 109.8 | 118.2 | 109.1 | 1.8 | 1.7 | 1.7 | 2.4 | 1.6 | 9.7 | 11.2 | 0.8 | 0.8 | 0.3 | 2.0 | 10.5 |
| Equity and liabilities | PLN m | 10,292.2 | 11,102.5 | 13,057.9 | 12,319.9 | 13,141.0 | 14,507.4 | 14,952.4 | 15,216.0 | 15,761.6 | 17,091.6 | 17,016.4 | 17,727.4 | 19,044.3 | 19,576.7 | 20,466.1 | 20,396.6 | 20,472.4 | 19,959.0 | 20,357.9 | 20,005.0 | 19,932.1 | 20,249.9 | 19,961.0 | 20,284.8 | 19,652.6 | 19,633.6 | 19,935.1 | 18,947.2 |
| Share capital | PLN m | 113.7 | 113.7 | 113.7 | 113.7 | 113.7 | 113.7 | 129.9 | 129.9 | 129.9 | 129.9 | 129.9 | 129.9 | 129.9 | 129.9 | 129.9 | 129.9 | 129.9 | 129.9 | 129.9 | 129.9 | 129.9 | 129.9 | 129.9 | 129.9 | 129.9 | 129.9 | 129.9 | 184.9 |
| Share premium | PLN m | 971.0 | 971.0 | 971.0 | 971.0 | 971.0 | 971.0 | 1,311.3 | 1,311.3 | 1,311.3 | 1,311.3 | 1,311.3 | 1,311.3 | 1,311.3 | 1,311.3 | 1,311.3 | 1,311.3 | 1,311.3 | 1,311.3 | 1,311.3 | 1,311.3 | 1,311.3 | 1,311.3 | 1,311.3 | 1,311.3 | 1,311.3 | 1,311.3 | 1,311.3 | 2,229.6 |
| Cash flow hedging reserve | PLN m | -0.7 | 133.5 | 201.4 | -272.6 | -419.3 | -142.4 | -385.1 | -129.9 | -36.8 | -217.5 | -281.1 | -60.9 | 61.0 | 36.6 | 24.3 | -220.7 | -412.5 | |||||||||||
| Retained earnings | PLN m | 5,139.3 | 5,537.3 | 5,299.4 | 4,430.2 | 3,780.1 | 4,524.8 | 5,116.9 | 5,353.9 | 5,390.5 | 4,742.6 | 5,794.7 | 6,046.0 | 6,685.3 | 6,956.6 | 6,625.2 | 6,700.4 | 7,297.5 | 6,768.6 | 7,394.6 | 7,627.4 | 7,476.2 | 7,350.1 | 7,687.4 | 7,666.8 | 7,634.5 | 7,512.0 | 7,476.9 | 6,191.0 |
| Exchange differences on translating foreign operations |
PLN m |
-11.1 |
-13.7 |
-10.0 | 7.0 | 126.2 | 31.4 | 28.3 | 14.3 | 6.3 | 34.4 | 15.6 | 12.3 | 6.3 | 7.8 | 53.6 | 59.1 | 33.1 | 44.1 | 37.0 | 33.9 | 49.9 | 55.9 | 35.3 | 20.3 | 25.2 | 20.2 | 24.3 | 65.3 |
| Equity - shareholders of dominant entity | PLN m | 6,212.9 | 6,608.3 | 6,374.1 | 5,521.9 | 4,991.0 | 5,640.9 | 6,586.4 | 6,809.4 | 6,838.0 | 6,218.2 | 7,251.5 | 7,498.8 | 8,266.3 | 8,607.0 | 7,847.4 | 7,781.4 | 8,629.4 | 7,868.8 | 8,742.9 | 9,065.7 | 8,749.8 | 8,566.1 | 9,103.0 | 9,189.3 | 9,137.5 | 8,997.7 | 8,721.7 | 8,258.3 |
| Non-controlling interests | PLN m | 345.6 | 367.8 | 381.8 | 396.1 | 388.6 | 404.5 | 35.0 | 36.8 | 17.1 | 15.8 | 14.6 | 14.7 | 3.4 | 1.0 | 1.1 | 1.0 | 1.0 | 0.9 | 0.9 | 0.7 | 0.4 | 0.4 | 0.3 | 0.3 | 0.3 | 0.2 | 0.2 | 0.2 |
| Shareholders equity | PLN m | 6,558.5 | 6,976.1 | 6,755.9 | 5,918.0 | 5,379.6 | 6,045.4 | 6,621.4 | 6,846.2 | 6,855.1 | 6,234.0 | 7,266.1 | 7,513.5 | 8,269.7 | 8,608.0 | 7,848.5 | 7,782.4 | 8,630.4 | 7,869.7 | 8,743.8 | 9,066.4 | 8,750.2 | 8,566.5 | 9,103.3 | 9,189.6 | 9,137.8 | 8,997.9 | 8,721.9 | 8,258.5 |
| Liabilities | PLN m | 3,733.7 | 4,126.4 | 6,302.0 | 6,401.9 | 7,761.4 | 8,462.0 | 8,331.0 | 8,369.8 | 8,906.5 | 10,857.6 | 9,750.3 | 10,213.9 | 10,774.6 | 10,968.7 | 12,617.6 | 12,614.2 | 11,842.0 | 12,089.3 | 11,614.1 | 10,938.6 | 11,181.9 | 11,683.4 | 10,857.7 | 11,095.2 | 10,514.8 | 10,635.7 | 11,213.2 | 10,688.7 |
| Non-current borrowings, other debt instruments and finance lease liabilities |
PLN m |
1,011.4 |
1,124.8 |
1,822.0 | 3,412.2 | 4,786.5 | 4,714.6 | 4,677.8 | 4,942.6 | 5,247.4 | 6,245.4 | 5,536.6 | 4,403.5 | 4,385.8 | 4,381.3 | 6,311.8 | 5,161.5 | 4,647.2 | 5,051.7 | 4,513.4 | 4,462.1 | 4,858.2 | 4,851.1 | 4,502.0 | 4,496.2 | 4,565.5 | 4,326.2 | 4,464.5 | 4,495.6 |
| Current borrowings, other debt instruments and finance lease liabilities |
PLN m |
274.7 |
489.2 |
1,410.4 | 507.4 | 509.9 | 618.7 | 660.6 | 748.6 | 591.1 | 894.7 | 648.0 | 1,923.3 | 1,828.8 | 2,219.7 | 998.5 | 2,427.2 | 2,720.4 | 2,526.8 | 2,322.3 | 2,094.6 | 1,793.8 | 1,610.6 | 1,535.9 | 1,715.2 | 1,766.9 | 2,135.0 | 2,040.2 | 2,168.1 |
| Debt and Capital employed* | |||||||||||||||||||||||||||||
| Financial debt | PLN m | 1,286.1 | 1,614.0 | 3,232.4 | 3,919.6 | 5,296.4 | 5,333.3 | 5,338.4 | 5,691.2 | 5,838.5 | 7,140.1 | 6,184.6 | 6,326.8 | 6,214.6 | 6,601.0 | 7,310.3 | 7,588.7 | 7,367.6 | 7,578.5 | 6,835.7 | 6,556.7 | 6,652.0 | 6,461.7 | 6,037.9 | 6,211.4 | 6,332.4 | 6,461.2 | 6,504.7 | 6,663.7 |
| Net debt | PLN m | 499.7 | 910.7 | 2,185.3 | 3,245.5 | 4,853.6 | 4,722.8 | 4,928.3 | 5,346.1 | 5,439.6 | 6,703.8 | 5,777.3 | 5,944.2 | 5,694.5 | 6,259.0 | 6,920.1 | 7,205.0 | 7,065.9 | 7,211.0 | 6,354.9 | 6,290.6 | 6,366.9 | 6,115.8 | 5,731.6 | 5,715.6 | 5,996.4 | 6,019.4 | 6,100.7 | 6,315.5 |
| Capital employed | PLN m | 7,058.2 | 7,886.8 | 8,941.2 | 9,163.5 | 10,233.2 | 10,768.2 | 11,549.7 | 12,192.3 | 12,294.7 | 12,937.8 | 13,043.4 | 13,457.7 | 13,964.2 | 14,867.0 | 14,768.6 | 14,987.4 | 15,696.3 | 15,080.7 | 15,098.7 | 15,357.0 | 15,117.1 | 14,682.3 | 14,834.9 | 14,905.2 | 15,134.2 | 15,017.3 | 14,822.6 | 14,574.0 |
* As of 31.12.2011 financial debt includes current and non-current borrowings, other debt instruments and finance lease liabilities